Live through the eyes of
your business
At the end of the day we all need just one thing...
Clear, Concise and Precise information that can facilitate management discussion and action, quickly.
Features
Report on right now. And how things are changing.
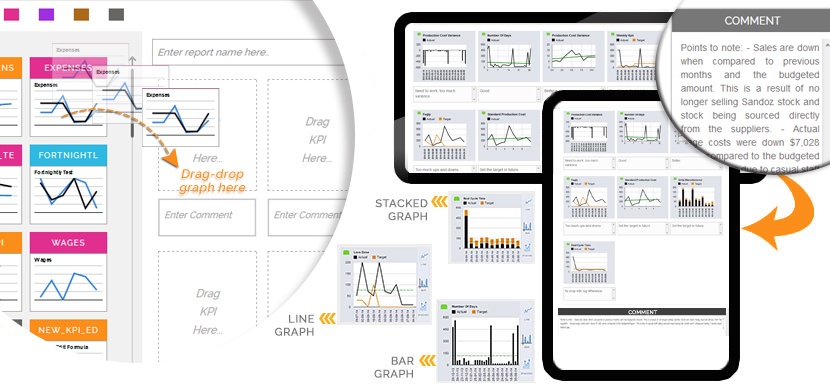
Use KPI Reports to show a snapshot of your business at any given moment. Or generate a KPI Scorecard to show how things have changed over time.
Ezzy KPI lets you generate a range of graphs to make complicated performance information easier to digest. It’s ideal for stakeholders at any level, from managers to busy executives.
And with our flexible drag-and-drop interface, you can bring different KPI graphs together, add comments, print, or launch a presentation.

Features List
- Spend less time on spreadsheets. And more time where it counts.
- Accurate performance information. In just one step.
- Key Performance Indicators. Instantly.
- Report on right now. And how things are changing.
- Detailed KPI templates. Ready to use.
- Report on your Key Success Factors. And share your findings easily.
- Ezzy KPI. Ideal for accountants and consultants.
